S-Curve in Project Management: Definition, Construction, Interpretation and Advanced Control in 2026
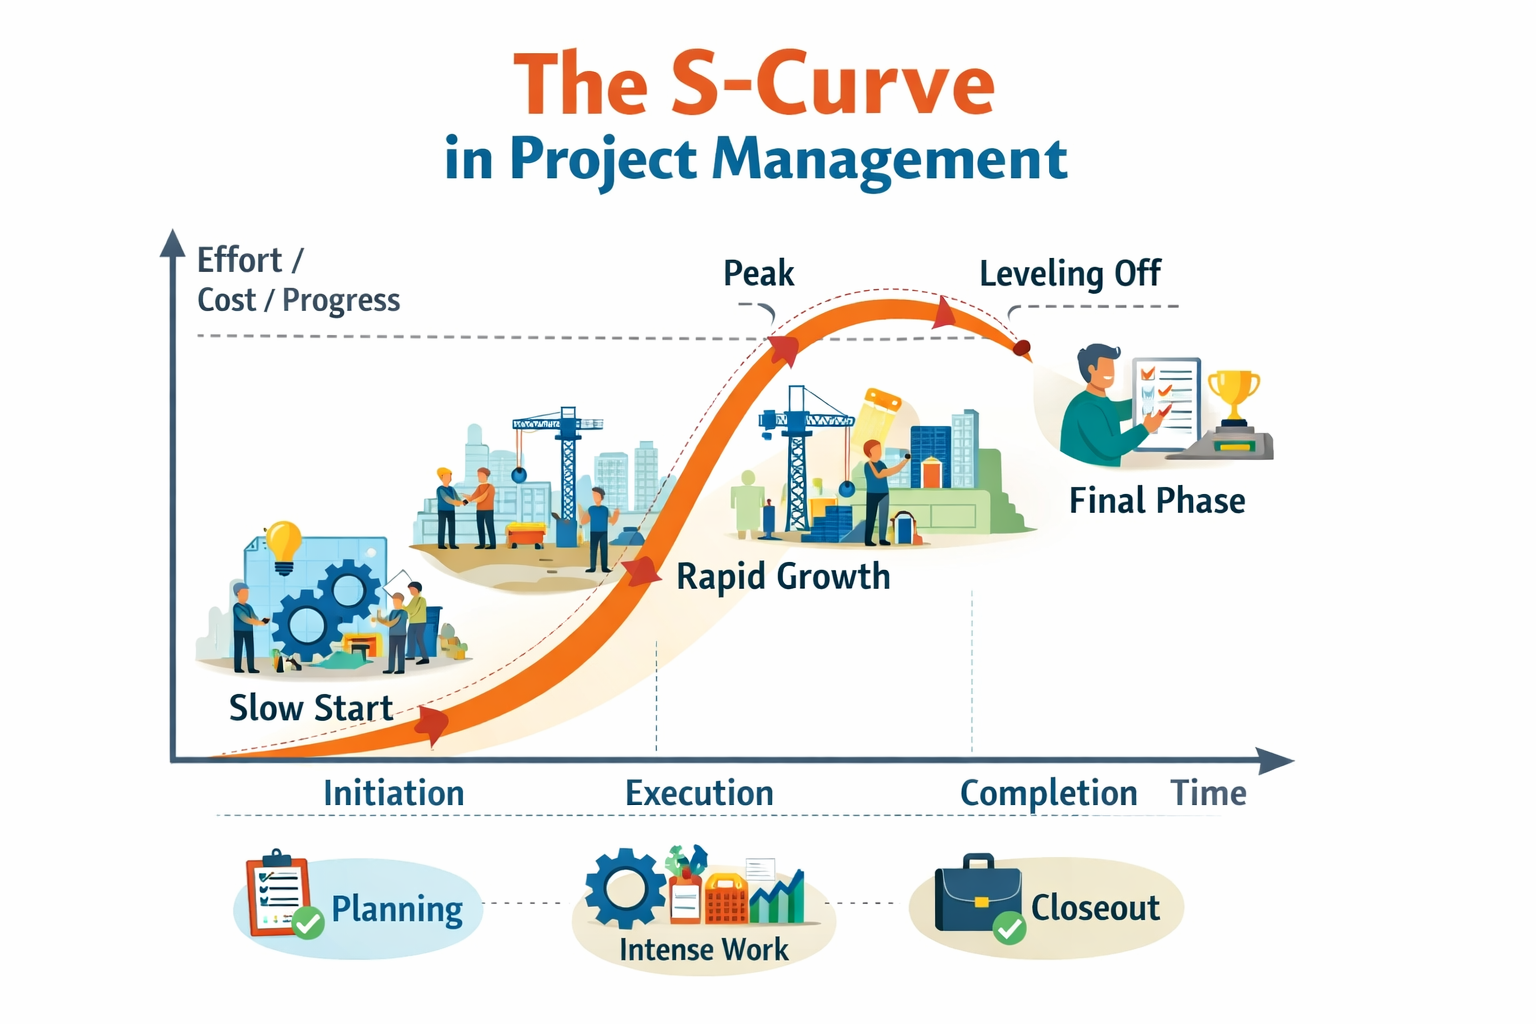
The S-curve in project management is one of the most powerful visual tools for measuring, monitoring and forecasting project performance over time. It represents the cumulative evolution of a key variable—such as cost, effort, physical progress or earned value—plotted against the project timeline to compare planned versus actual performance. Its characteristic S-shape reflects the natural lifecycle of most projects: slow initiation, rapid execution, and gradual stabilization toward completion. In 2026, as organizations increasingly rely on integrated dashboards and predictive analytics, the S-curve has become a standard component of project controls across industries including construction, IT, infrastructure, energy and large-scale transformation programs. Rather than serving as a static reporting chart, it now functions as a proactive decision-making instrument that supports cost optimization, schedule recovery and risk anticipation at executive level.
Strategic Definition of the S-Curve and Its Role in Modern Project Control
An S-curve is a cumulative graphical representation showing how a selected performance indicator evolves throughout the project lifecycle. It enables comparison between a validated baseline and real performance data in order to detect deviations early and assess trend behavior over time. Unlike traditional progress reports or Gantt charts, the S-curve highlights acceleration patterns, performance gaps and structural slowdowns that may otherwise remain hidden in spreadsheets. When integrated with Earned Value Management (EVM), it becomes a multidimensional performance control mechanism that evaluates cost, schedule and scope simultaneously. In mature organizations, the S-curve is embedded within governance frameworks and used at steering committee level to support financial forecasting and contractual compliance. Its analytical depth makes it indispensable for complex or high-budget projects.
Why the Curve Takes a Sigmoid Shape
The S-shape reflects the intrinsic rhythm of structured project lifecycles and resource deployment patterns. During the initiation and planning phases, activity levels and expenditures remain relatively low, producing a shallow slope at the beginning of the curve. As execution intensifies and resources are fully mobilized, cumulative progress and costs accelerate rapidly, creating the steep central section that characterizes the middle of the S. Toward project closure, activities shift toward testing, validation and administrative wrap-up, leading to reduced incremental growth and a flattening of the curve. This predictable pattern explains why cumulative project metrics rarely grow linearly over time. Understanding this natural dynamic is essential for distinguishing between expected behavior and genuine performance anomalies.
Types of S-Curves Used in Project Management
The S-curve can represent multiple performance dimensions depending on the objective of the analysis and the governance maturity of the organization. Advanced project environments differentiate between cost S-curves, physical progress S-curves and earned value S-curves, each offering a specific lens on performance. This distinction prevents the common confusion between financial expenditure and actual productive progress, which often diverge in real-world projects. In 2026, enterprise project management platforms allow these curves to be superimposed dynamically, enabling multidimensional performance monitoring in real time. Selecting the appropriate S-curve type depends on the project’s contractual model, risk profile and reporting requirements. A clear understanding of these variants significantly enhances analytical accuracy.
Planned vs. Actual Cost S-Curve
The cost S-curve compares cumulative planned budget against cumulative actual expenditure over time. When actual costs rise above the planned trajectory, the project is spending faster than expected, signaling potential budget overruns or premature resource consumption. Conversely, underspending may indicate execution delays, procurement bottlenecks or incomplete work reporting rather than efficiency gains. Visual comparison enables project managers to identify deviations before they escalate into major financial risks. The cost S-curve is particularly relevant in fixed-price contracts or capital-intensive programs where cash flow control is critical. Its clarity makes it a preferred instrument for financial stakeholders and executive sponsors.
Earned Value S-Curve (EVM-Based)
The earned value (EV) S-curve represents the value of work actually performed, independent of how much money has been spent. It is analyzed alongside planned value (PV) and actual cost (AC) to evaluate performance from both schedule and cost perspectives simultaneously. This three-curve model forms the foundation of Earned Value Management, widely recognized as a best practice in complex project environments. According to a 2026 industry benchmark study, 68% of organizations managing projects above $5 million formally apply EVM methodologies, reflecting its strategic importance. By comparing EV to PV and AC, project leaders can quantify cost variance and schedule variance in measurable terms. The earned value S-curve therefore transforms visual monitoring into analytical performance control.
Physical Progress S-Curve
The physical progress S-curve measures cumulative production in tangible units such as constructed meters, installed equipment or delivered system components. It is particularly relevant in engineering and infrastructure projects where financial expenditure does not always correlate directly with technical completion. By comparing planned versus actual production quantities, managers can detect operational delays independently from cost performance. This separation avoids misleading conclusions that may arise from front-loaded procurement or advance payments. Integrating physical and financial curves strengthens transparency and reinforces governance integrity. It also supports claims management and contractual reporting in large-scale construction programs.
How to Build an S-Curve Step by Step
Constructing a reliable S-curve requires methodological discipline, validated planning data and consistent reporting processes. The first step involves establishing a formally approved baseline schedule and budget, which becomes the reference framework for all future comparisons. This baseline must be stable, documented and protected through structured change control procedures. Actual data should then be collected at regular intervals—weekly or monthly depending on project complexity—and converted into cumulative values. Data accuracy is critical because distorted input inevitably leads to misleading trends and flawed forecasts. Standardized construction processes increase reliability and improve stakeholder confidence in the results.
Structured Construction Process
The operational process can be organized into a logical sequence that ensures consistency and repeatability of performance measurement. Each step transforms raw project data into actionable management insight, strengthening the quality of executive reporting. Whether using Excel, Primavera, MS Project or advanced business intelligence platforms, cumulative values must be calculated accurately before graphical representation. Automated dashboards increasingly facilitate real-time updates and trend recalculations. Organizations that institutionalize this process significantly enhance decision-making agility and transparency. The following sequence reflects best practice implementation standards.
- Define the baseline: establish cumulative planned value per reporting period.
- Collect actual data: record real costs or physical progress at defined intervals.
- Calculate earned value: convert completed work into budgeted value.
- Plot cumulative curves: overlay planned, actual and earned value data.
- Analyze variances: calculate performance indices and interpret trends.
Advanced Interpretation of the S-Curve
Expert interpretation focuses on analyzing vertical and horizontal gaps between curves rather than simply observing their positions. A vertical gap between earned value and actual cost represents a cost variance, while a gap between earned value and planned value indicates schedule variance. The Cost Performance Index (CPI) and Schedule Performance Index (SPI) synthesize these variances into ratios that provide immediate performance insight. For instance, a CPI below 1 signals cost overrun, whereas an SPI below 1 reflects schedule delay. Tracking these indicators across reporting periods enables forecasting of final outcomes using predictive formulas such as Estimate at Completion (EAC). Trend consistency matters more than isolated fluctuations.
Trend Analysis and Early Warning Signals
The slope of the S-curve often reveals strategic signals that static performance snapshots fail to capture. A gradual flattening may indicate productivity decline, resource demobilization or supply chain disruption. Conversely, a sharp increase in spending without proportional earned value growth can signal inefficient cost absorption or rework. Advanced project control teams analyze rate-of-change patterns rather than absolute positions to anticipate risks early. This dynamic reading transforms the S-curve into a predictive management instrument. In volatile economic contexts such as 2026, this anticipatory capacity represents a decisive competitive advantage.
Forecasting and Strategic Control in 2026
In 2026, leading organizations leverage S-curves to perform forward-looking scenario analysis and refine strategic projections continuously. By integrating historical trend data with performance indices, project managers can estimate probable completion dates and forecast final costs with increased reliability. Predictive modeling combines SPI trends, CPI stability and productivity assumptions to recalculate the Estimate at Completion dynamically. This forward-looking capability shifts the S-curve from descriptive reporting to proactive performance governance. Executives can trigger corrective actions such as scope reprioritization, resource reinforcement or schedule compression strategies before contractual thresholds are breached. Forecasting accuracy becomes a central performance differentiator.
S-Curve Envelope as a Governance Control Mechanism
An advanced analytical technique involves defining an upper and lower tolerance band around the planned trajectory to create a performance S-curve envelope. If the actual curve crosses these predefined thresholds, an immediate root-cause analysis is triggered to prevent further deviation. This structured tolerance mechanism enhances governance discipline and reduces subjective interpretation of performance data. It is particularly effective in megaprojects or regulatory environments where deviation thresholds are contractually defined. By formalizing acceptable variance ranges, organizations institutionalize proactive intervention rather than reactive crisis management. The envelope approach reinforces executive confidence in performance monitoring systems.
Common Mistakes and Best Practices
Misapplication of the S-curve can create a false sense of control if underlying data lacks accuracy or methodological rigor. One frequent mistake involves equating expenditure with progress, ignoring the distinction between cost incurred and value generated. Another common issue is excessive rebaselining, which erases historical variance trends and weakens analytical continuity. Best practice requires maintaining baseline integrity and documenting all approved scope or budget changes transparently. Organizations should also ensure alignment between physical progress measurement and financial tracking systems. Strong governance transforms the S-curve into a credible and reliable decision-making instrument.
- Update cumulative data at consistent, documented intervals.
- Validate alignment between physical progress and financial reporting.
- Focus on trend evolution rather than isolated reporting points.
- Integrate qualitative risk analysis alongside quantitative metrics.
FAQ – S-Curve in Project Management
What is the main purpose of an S-curve?
The primary purpose of an S-curve is to visualize cumulative project performance over time and compare planned versus actual outcomes. It allows managers to detect cost overruns, schedule delays and performance deviations early. By presenting complex data in a clear graphical format, it supports communication with executive stakeholders. It also serves as a forecasting foundation for predicting final project outcomes. Its value lies in combining clarity with analytical depth.
What is the difference between planned value and earned value?
Planned value represents the budgeted cost of work scheduled at a specific date, while earned value reflects the budgeted cost of work actually completed by that date. This distinction allows managers to determine whether progress aligns with the original schedule. If earned value is lower than planned value, the project is behind schedule regardless of spending levels. When compared with actual cost, earned value reveals cost efficiency simultaneously. This integrated view strengthens financial and operational control.
Can S-curves be applied in agile environments?
S-curves can be adapted to agile frameworks by tracking cumulative story points, delivered features or business value increments. They provide a macro-level performance overview complementing sprint-level burndown charts. However, their effectiveness depends on relative backlog stability and disciplined estimation practices. When used appropriately, they enhance long-term visibility beyond short iteration cycles. This hybrid approach supports strategic oversight while preserving agile flexibility.