5M Method (Ishikawa Diagram): Complete 2026 Guide to Root Cause Analysis and Operational Excellence
The 5M method, also known as the Ishikawa diagram, cause-and-effect diagram, or fishbone diagram, remains one of the most powerful structured approaches for identifying root causes behind complex problems. Organizations across manufacturing, services, healthcare, IT, logistics, and project management rely on this framework to prevent superficial decision-making and eliminate recurring issues at their source. In 2026, where operational resilience, risk mitigation, and data-driven governance define competitive advantage, structured root cause analysis has become a strategic necessity rather than a quality department tool. A 2026 cross-industry operational excellence report indicates that 72% of high-performing organizations systematically use formal root cause methodologies, with the 5M framework ranking among the top three tools deployed. Understanding how to apply the 5M model rigorously enables organizations to reduce defects, improve process reliability, and strengthen long-term performance without relying on guesswork or reactive management.
What Is the 5M Method?
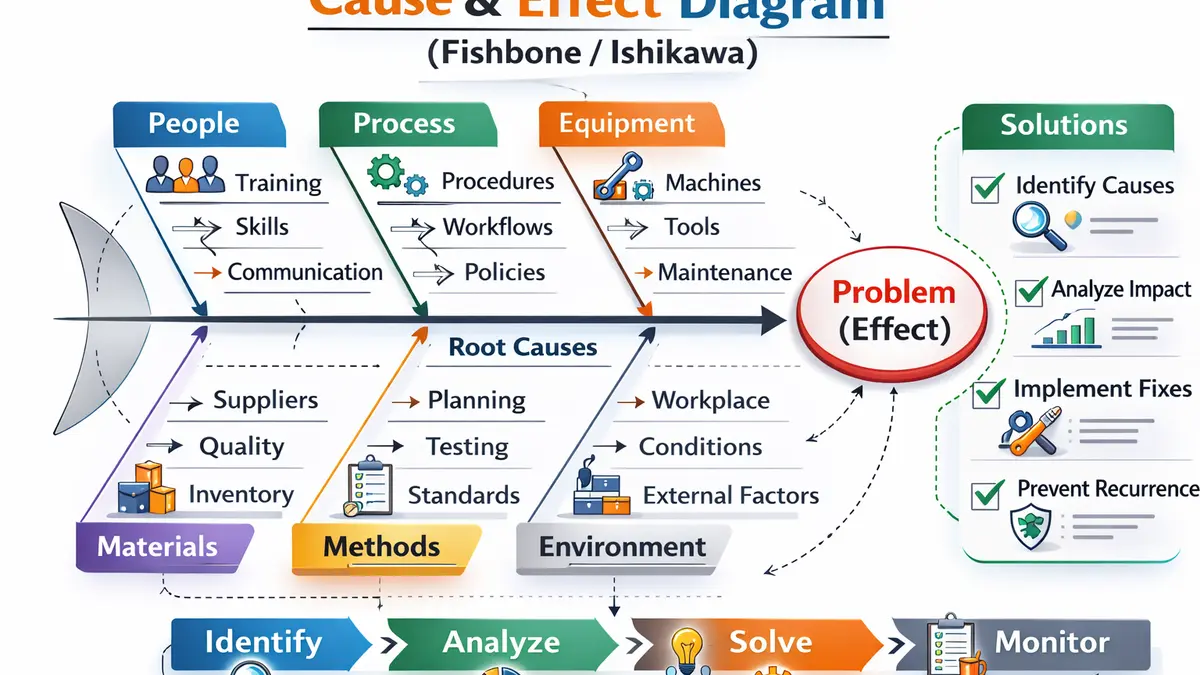
The 5M method is a structured analytical framework used to categorize potential causes of a problem into five major families, ensuring a comprehensive and systemic exploration of contributing factors. It forms the backbone of the Ishikawa diagram, a visual representation shaped like a fish skeleton where the head represents the effect or problem and the bones represent grouped causes. Developed by Kaoru Ishikawa in the context of total quality management, the tool was originally designed to support industrial quality improvement but has since expanded into virtually every sector. The fundamental objective is to prevent narrow thinking by forcing teams to explore multiple dimensions of causality rather than focusing prematurely on obvious explanations. By structuring hypotheses under five controlled categories, organizations avoid cognitive bias and strengthen analytical rigor.
Difference Between the 5M Method and the Ishikawa Diagram
The 5M method refers specifically to the categorization logic used to group causes, while the Ishikawa diagram refers to the visual representation of those causes in a structured format. In practice, the diagram can exist with other categorizations such as 6M or 7M, depending on industry needs, whereas the 5M logic strictly defines five classical dimensions. This distinction is important because organizations often confuse the visual tool with the conceptual framework, which limits adaptability. The power of the approach lies not in the drawing itself but in the disciplined exploration of causal families. When teams understand this distinction, they can adapt the structure without weakening analytical depth.
The Five Categories Explained in Depth
The five categories of the 5M method cover the primary systemic dimensions influencing a process outcome, ensuring that analysis remains holistic rather than reactive. Each “M” represents a family of potential root causes that interact dynamically with others, reinforcing the systemic nature of operational challenges. Applying the framework effectively requires exploring each branch thoroughly, asking targeted questions, and validating assumptions with measurable data. A superficial listing of causes weakens the methodology, whereas disciplined exploration generates actionable insights. The 5M structure functions as both a thinking model and a diagnostic safeguard.
Manpower
The Manpower category encompasses all human-related factors influencing the process, including competencies, training, communication quality, workload distribution, and leadership clarity. It extends beyond individual error and examines systemic human influences such as onboarding quality, skill gaps, team coordination, and organizational culture. In project environments, this dimension may reveal unclear roles, insufficient stakeholder alignment, or resource allocation imbalances. In manufacturing, it may uncover training deficiencies or fatigue-related performance variability. Objective indicators such as turnover rate, training hours per employee, or absenteeism levels strengthen analysis and prevent subjective blame.
Methods
The Methods category examines procedures, workflows, standard operating instructions, and governance models that structure task execution. Ineffective, outdated, or poorly documented processes frequently generate recurring defects despite competent personnel and reliable equipment. In digital environments, this includes approval flows, sprint structures, compliance procedures, and documentation systems. Organizations often discover that procedural misalignment rather than technical failure explains repeated inefficiencies. Reviewing process clarity, documentation updates, and adherence levels ensures structural consistency within the system.
Machines or Equipment
The Machines category refers to physical equipment, infrastructure, software tools, automation systems, and technological resources involved in the process. Equipment degradation, configuration errors, calibration drift, or outdated software versions can significantly affect performance outcomes. In industrial contexts, metrics such as mean time between failures and maintenance compliance rates provide valuable insight. In service or IT contexts, system latency, tool usability, or cybersecurity vulnerabilities may emerge as causal contributors. Data-backed technical analysis prevents misattribution of systemic problems to human factors alone.
Materials
The Materials category includes raw materials, components, input data, or any resource transformed within the process. Variability in supplier quality, inconsistent specifications, incomplete information, or defective inputs often propagate downstream defects. In service environments, materials may represent client data accuracy, documentation completeness, or contractual clarity. Supplier performance indicators and quality acceptance rates provide measurable evidence when evaluating this branch. Exploring this dimension broadens analysis beyond internal operations to the extended value chain.
Mother Nature or Environment
The Environment, sometimes referred to as Mother Nature, encompasses external and contextual conditions influencing the process. This includes physical factors such as temperature, humidity, noise, and lighting, as well as organizational climate, regulatory constraints, and market volatility. High-pressure deadlines, workspace design, or economic disruptions may indirectly shape operational outcomes. By integrating environmental variables, the 5M model reinforces systemic thinking and reduces oversimplified conclusions. Contextual awareness strengthens strategic decision-making.
Extensions: 6M, 7M, and Industry Adaptations
While the classical 5M framework remains widely used, many organizations adapt it by adding categories to enhance precision in complex environments. The 6M version commonly introduces Measurement, acknowledging that flawed data collection or inaccurate indicators can distort performance evaluation. Other adaptations include Management or Money to account for governance structures and financial constraints influencing outcomes. The objective is not to increase complexity but to ensure completeness relative to sector-specific realities. In 2026, regulated industries such as aerospace and pharmaceuticals frequently deploy extended models to satisfy audit traceability requirements. Structured flexibility enhances relevance without compromising methodological integrity.
How to Conduct an Effective 5M Workshop
Implementing the 5M method effectively requires structured facilitation rather than spontaneous discussion. A typical workshop lasts between 45 and 90 minutes depending on problem complexity and participant diversity. Preparation includes defining the problem statement precisely, gathering relevant data, and selecting cross-functional stakeholders. The session must prioritize open ideation before categorization to avoid early bias. The outcome should always include prioritized causes and a defined action plan.
Step 1: Define the Problem Precisely
A well-defined problem statement forms the foundation of meaningful root cause analysis. The statement must be measurable, time-bound, and supported by data to prevent subjective interpretations. For example, “customer dissatisfaction” lacks analytical clarity, whereas “a 15% increase in customer complaints during Q2 2026 related to delivery delays” provides measurable scope. Precision narrows the analytical field while enabling performance tracking after corrective action. Data-driven problem framing directly influences workshop effectiveness.
Step 2: Generate and Classify Potential Causes
Participants should generate hypotheses freely before assigning them to the appropriate 5M categories. This separation prevents constrained thinking and encourages creative exploration. Once ideas are collected, categorization into Manpower, Methods, Machines, Materials, and Environment structures the diagnostic map. Visual organization clarifies concentration areas and reveals causal density patterns. The visual model strengthens shared understanding and collaborative alignment.
Step 3: Prioritize and Identify Root Causes
Not all listed causes carry equal impact, making prioritization essential. Teams may apply impact-probability matrices, voting systems, or quantitative data analysis to identify high-leverage contributors. Combining the 5M framework with the 5 Whys technique enables deeper exploration of selected causes to reach the root cause. A true root cause demonstrates systemic influence and correctability. Without prioritization, analysis remains descriptive rather than transformative.
Practical Case Study: Manufacturing Example
A manufacturing company observes that its product defect rate has risen from 3% to 8.7% over six months, exceeding internal quality thresholds. The leadership team initiates a 5M analysis workshop involving quality control, production supervisors, maintenance engineers, and supply chain representatives. The problem statement specifies a measurable increase in assembly defects on Line B during the first half of 2026. Data analysis precedes brainstorming to ground discussions in objective metrics. This structured beginning enhances analytical credibility.
Under Manpower, the team identifies insufficient onboarding for new hires and inconsistent shift supervision. Under Methods, they discover outdated assembly instructions not reflecting a recent design update. The Machines branch reveals calibration drift in torque tools, while Materials analysis shows variability in a supplier component. Environmental factors include seasonal production pressure leading to overtime fatigue. This systemic mapping prevents simplistic blame assignment.
Prioritization reveals that torque miscalibration accounts for approximately 62% of detected defects, while procedural misalignment explains an additional 21%. Corrective actions include recalibration schedules, procedural updates, and structured retraining sessions. Within three months, the defect rate declines to 3.4%, demonstrating measurable improvement. The 5M method transforms abstract concerns into quantifiable corrective action. Data validation confirms sustained performance stabilization.
Best Practices for Maximum Impact
Effective application of the 5M method requires disciplined facilitation and evidence-based reasoning. Teams should avoid overpopulating branches with vague statements and instead formulate causes that can be verified or measured. Cross-functional participation enhances perspective diversity and reduces departmental bias. Documentation of assumptions and follow-up responsibilities ensures accountability. Regular integration of 5M analysis into performance reviews strengthens a culture of continuous improvement.
Common Mistakes to Avoid
One frequent mistake involves confusing symptoms with root causes, leading to corrective actions that treat effects rather than systemic origins. Another pitfall lies in focusing disproportionately on human factors while neglecting structural contributors. Workshops sometimes fail because participants lack relevant data or clarity regarding objectives. Skipping prioritization results in excessive action lists without strategic focus. Avoiding these errors preserves methodological credibility and long-term effectiveness.
Key Benefits of the 5M Method in 2026
- Structured root cause identification across multiple systemic dimensions.
- Reduced recurring defects through targeted corrective actions.
- Improved cross-functional collaboration and shared understanding.
- Data-driven decision-making aligned with governance standards.
- Enhanced operational resilience in volatile environments.
The increasing complexity of global supply chains and digital transformation initiatives in 2026 amplifies the relevance of systemic diagnostic tools. Organizations leveraging structured root cause analysis report up to 30% faster resolution times compared to reactive troubleshooting approaches. The 5M framework integrates seamlessly with Lean management, Six Sigma methodologies, and ISO-compliant quality systems. Its adaptability across sectors strengthens its strategic value. The method balances simplicity and analytical depth effectively.
Mini FAQ
What industries use the 5M method?
The 5M method applies to manufacturing, healthcare, IT services, logistics, education, and strategic project management. Any organization facing measurable process deviations can benefit from structured root cause analysis. Regulated industries particularly value its documentation clarity and audit traceability. Agile teams increasingly incorporate it into sprint retrospectives. Its universality reinforces cross-sector adoption.
How long does a 5M analysis take?
A standard workshop typically requires 45 to 90 minutes depending on complexity and preparation quality. Pre-collection of relevant data reduces discussion time and improves analytical depth. More complex systemic issues may require iterative sessions. Time investment correlates with potential cost savings from preventing recurrence. Structured facilitation ensures efficiency.
Is the 5M method still relevant in 2026?
The method remains highly relevant in 2026 due to increased regulatory scrutiny, digital process complexity, and supply chain interdependencies. Structured problem-solving tools reduce organizational risk exposure and improve resilience. Data-driven governance models rely on formalized analytical frameworks such as 5M. Its integration with digital dashboards enhances monitoring capabilities. The method evolves alongside modern management practices.
Step-by-Step Summary for Implementation
- Define the measurable problem clearly using quantitative data.
- Gather cross-functional stakeholders to ensure systemic perspective.
- Brainstorm potential causes openly without premature filtering.
- Categorize causes into the five Ms for structural clarity.
- Prioritize high-impact contributors using objective criteria.
- Apply deeper analysis techniques such as 5 Whys where needed.
- Implement corrective actions with measurable KPIs.
The 5M method continues to serve as a cornerstone of structured problem-solving and root cause analysis in modern organizations. Its disciplined approach transforms ambiguity into measurable insight, supports cross-functional collaboration, and aligns corrective action with strategic objectives. By embedding the methodology into routine governance practices, organizations strengthen reliability, reduce risk, and enhance long-term performance. In 2026 and beyond, structured analytical thinking remains a defining capability of high-performing enterprises. The enduring relevance of the Ishikawa framework confirms its value as both a practical and strategic management tool.